This week we read an evaluation of different methods of visualizing data—their strengths and their flaws. Catherine D’Ignazio and Lauren Klein take on the question of authority and perspective in data visualization in a chapter in Data Feminism while Nathan Yau explains the numerous ways in which data visualization can be construed while still maintaining its aura of objectivity in “Defense Against Dishonest Charts.”[1] Eryk Salvaggio and Victoria Turk analyze how biases and gaps in data appear in one of the newest forms of data visualization, artificial intelligence (AI), in their result reports for experiments they had conducted using AI.[2] Kaylee Alexander and Emily Lawhead posit a more optimistic view of AI by placing it within the context of other media inventions like photography. These various articles all grapple with what it means to live in a world not only inundated with data, but also with generative technology that can process data by itself.
Ignazio and Klein’s article is a good place to start to challenge this idea of rational data visualization. Sure, numbers and statistics can be collected objectively, but the story they tell can be communicated powerfully—and even emotionally! —to the viewer. Take Periscopic’s data visualization of US gun deaths in 2013, an example used by Ignazio and Klein. The data collected and displayed are quantitative, the amount of people killed by guns and the number of more years these victims could have lived had they not been cut short, but it is communicated in a way that allows the viewer to better visualize this loss. Unlike a chart or plot of the amount of mass shootings, this graph focuses on the victims rather than the crime and associates the number of people killed with the amount of time they could have lived. Taken together, this visualization of data illicits an emotional reaction.
Yau describes in “Defense of Dishonest Charts” how data—objective, quantifiable data—can be visualized to prove one point better than another. Laying out the basics of data visualization and good data visualization practice in “Representing Data” in the book Data Points: Visualization That Means Something, in this article, Yau describes how data can be manipulated through different elements of data charting and how to be a vigilant consumer of this data. His article is written with the assumption that data visualization features like graphs automatically signal to readers a sense of objectivity.
Artificial intelligence generates images and responses from massive amounts of data scraped from across the internet. Salvaggio and Turk use artificial intelligence image generators to explain how artificial intelligence processes this data to create the most “average” of images in response to prompts, and in consequence reveal both gaps and biases in data. Salvaggio explains that the images produced by artificial intelligence are not so much pictures as they are representations of data. Any weirdness or distortion in images, like those produced in the images of people kissing, is attributed to a lack in adequate data to create these images. In Salvaggio’s case, a bias was revealed that showed predominantly single-race, heterosexual couples. His study was run in 2024, so the picture-producing ability of AI has likely increased dramatically, but it still likely features similar biases.
Turk’s article on AI image generation focuses exclusively on generated images that reproduce stereotypes of cultures and gender ideals. The article artfully incorporates interaction with the different images produced by AI and highlights common themes across prompts. For example, the inclusion of chopsticks in images produced of “Chinese food.” Turk’s article demonstrates how AI is like an echo chamber of western stereotypes of other cultures. A fact that Ignazio and Klein also address in their article about unobjective data visualization. Like Turk, Ignazio and Klein reveal how the authority of the west, best embodied in a white male perspective, underlies most data visualization tactics. In this way, these stereotypical images of cultures produced reveal how western assumption of other cultures—eerily reminiscent of nineteenth-century imperial colonial efforts to visualize and display non-western cultures—is still largely at work within existing data.
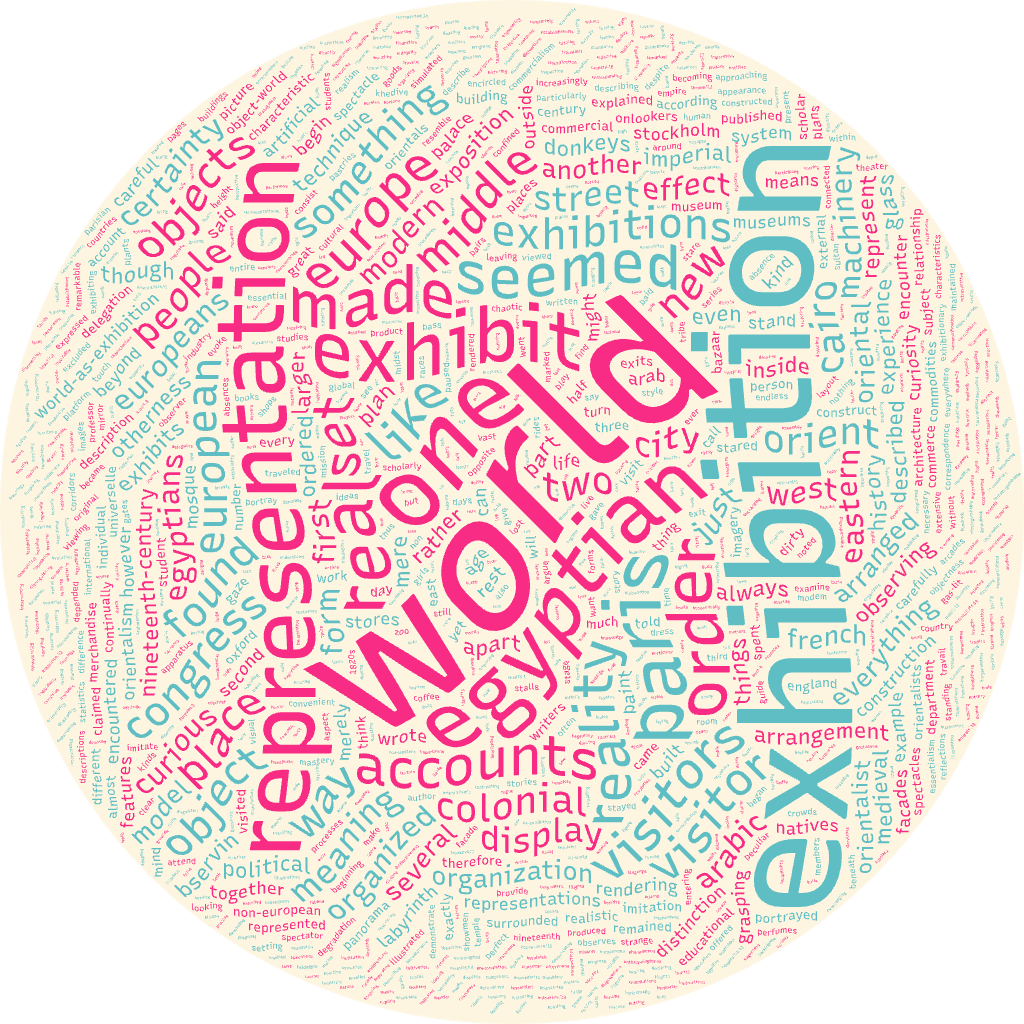
While I did not use AI images to visualize data, I used the more accessible Tag Crowd to create a visualization of words used in Timothy Mitchell’s “Orientalism and the Exhibitionary Order.”[3] The word cloud did extract words that communicated the main themes of Mitchell’s seminal text including “world,” “exhibition,” and “representation.” A closer look at words used less frequently, like “Egyptian,” “European,” “objects,” “colonial,” and “nineteenth-century” may even reveal to a person who has not read the text before a general idea of what it is about. In this way, I think that a word cloud to visualize quantitative data, the frequency of a word used in a given text, is helpful more as a pedagogical tool or method to communicate themes of one’s research.
Turning to Alexander and Lawhead’s article “Data and Discontent,” they argue that art created with artificial intelligence will be the way of the future and that the fear and anxiety produced by its entrance on the global stage will be abated within time like that of photography. As a class, we discussed several flaws to this idea. Despite the human required to create prompts, it seems as though the hand of the human is largely out of the loop. Can a person really make art from a mass of art-as-data available freely to be consumed and processed by AI models? The answer we concluded with was a resounding no.
Despite its claims to objectivity, data visualization is anything but. This has only been amplified with the advent of artificial intelligence. In a world increasingly flooded with data, it is the now, more than ever, the responsibility of the consumer to critically analyze how to use this data.
[1] Catherine D’Ignazio and Lauren Klein, “On Rational, Scientific, Objective Viewpoints form Mythical, Imaginary, Impossible Standpoints,” in Data Feminism (MIT Press, 2020).; Nathan Yau, “Defense Against Dishonest Charts,” accessed October 25, 2026, https://flowingdata.com/projects/dishonest-charts/.
[2] Eryk Salvaggio, “How to Read an AI Image,” Cybernetic Forests. Last updates August 2024. https://www.cyberneticforests.com/news/how-to-read-an-ai-image.; Victoria Turk, “How AI reduces the World to Stereotypes,” Rest of World, October 20, 2023, https://restofworld.org/2023/ai-image-stereotypes/.
[3] Timothy Mitchell, “Orientalism and the Exhibitionary Order,” in Grasping the World (Routledge, 2004): 442-460.
Leave a Reply